网页
综合
更新时间 2026-11-06 10:36:47
MongoDB 9.0 vs. 8.0 vs. 8.3: A Quick First Look at Performance - Percona
Enterprise-ready open source PostgreSQL
Percona Software for PostgreSQL
Open source PostgreSQL software for production workloads
Model infrastructure requirements for PostgreSQL deployments.
Download PostgreSQL software and tools
Enterprise Support and Services
Expert help to run PostgreSQL in production
Open source MySQL for enterprise use
Percona Software for MySQL
Production-ready open source MySQL software
Compare DBaaS vs MySQL on Kubernetes cloud costs
Download MySQL software and tools
Enterprise Support and Services
Expert help to run MySQL in production
Enterprise-grade value for MongoDB®
Percona Software for MongoDB®
Source-available, enterprise-grade compatible software for MongoDB®
Compare MongoDB® deployment options, costs, and trade-offs.
Download MongoDB® software and tools
Enterprise Support and Services
Expert help to run MongoDB® in production
Run and manage Redis or Valkey
Discover the benefits of migrating from Redis to Valkey
Download Valkey software and tools
Enterprise Support and Services
Expert help to run Redis and Valkey in production
Monitoring & Management (PMM)
Coroot Percona Edition
Expert Consulting and Services
In my previous post I said that MongoDB published some impressive numbers for 9.0, but I couldn’t find any details about how the tests were done. I ended with “always run your own benchmarks”. So I figured I should follow my own advice. Let me be clear up front: this is a first, quick test, not an extensive benchmark by any means. It’s one workload, one hardware configuration for three different data sizes. Treat the numbers as an early indication, not a verdict. I’m sharing them anyway, together with everything you need to do your own tests.
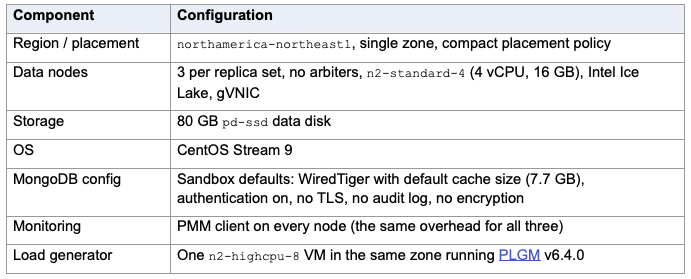
I deployed everything with PSMDB Sandbox on Google Cloud. Each version ran on its own three-node replica set, and the three replica sets were identical except for the MongoDB package version:
Note: PSMDB is built from the same upstream code, and none of the PSMDB-specific features were enabled in order to keep the configuration as similar as possible.
I used PLGM’s built-in “flights” workload (collection airline.flights, 7 secondary indexes):
I ran the workload three times, with three data sizes:
Queries read the seeded documents, while inserts keep adding new ones, so the collection grows during the run. “Fits in RAM” here means the compressed data still fits in the operating system’s file cache, so a WiredTiger cache miss usually doesn’t need a disk read. With 8M documents, the compressed collection is about as big as the server’s entire memory. The compression ratio is about 2:1, so 25% of the documents can fit in WTcache. All runs were deterministic. Each command is generated from a fixed seed, iteration, worker and operation number, so every MongoDB version received exactly the same commands with the same values, and in the same order for each worker. Each worker had a pass of 250,000 commands per iteration. In the 1M and 4M runs every version finished at least one full pass, and PLGM’s traffic fingerprints matched. In the 8M run the servers were too slow to finish a pass in 30 minutes, so each version sent the first 2.7–2.8M commands of the same sequence. PLGM flags that as incomplete. Because the commands are still identical, I compared them operation by operation anyway. PLGM ran the three versions one after another, so each one had the load generator to itself.
Figure 1: Throughput with 1M, 4M and 8M documents. Percentages are relative to MongoDB 9.0.4.
Figure 2: Average latency with 1M, 4M and 8M documents.
Figure 3: Throughput over time with 1M documents, in 1-minute averages. Each line is plotted on its own run clock.
Figure 4: Throughput over time with 4M documents, in 1-minute averages. 9.0 stayed ahead for the whole run.
Figure 5: Throughput over time with 8M documents, in 1-minute averages. The three lines overlap most of the time.
Percona Software for PostgreSQL
Open source PostgreSQL software for production workloads
Model infrastructure requirements for PostgreSQL deployments.
Download PostgreSQL software and tools
Enterprise Support and Services
Expert help to run PostgreSQL in production
Open source MySQL for enterprise use
Percona Software for MySQL
Production-ready open source MySQL software
Compare DBaaS vs MySQL on Kubernetes cloud costs
Download MySQL software and tools
Enterprise Support and Services
Expert help to run MySQL in production
Enterprise-grade value for MongoDB®
Percona Software for MongoDB®
Source-available, enterprise-grade compatible software for MongoDB®
Compare MongoDB® deployment options, costs, and trade-offs.
Download MongoDB® software and tools
Enterprise Support and Services
Expert help to run MongoDB® in production
Run and manage Redis or Valkey
Discover the benefits of migrating from Redis to Valkey
Download Valkey software and tools
Enterprise Support and Services
Expert help to run Redis and Valkey in production
Monitoring & Management (PMM)
Coroot Percona Edition
Expert Consulting and Services
In my previous post I said that MongoDB published some impressive numbers for 9.0, but I couldn’t find any details about how the tests were done. I ended with “always run your own benchmarks”. So I figured I should follow my own advice. Let me be clear up front: this is a first, quick test, not an extensive benchmark by any means. It’s one workload, one hardware configuration for three different data sizes. Treat the numbers as an early indication, not a verdict. I’m sharing them anyway, together with everything you need to do your own tests.
I deployed everything with PSMDB Sandbox on Google Cloud. Each version ran on its own three-node replica set, and the three replica sets were identical except for the MongoDB package version:
Note: PSMDB is built from the same upstream code, and none of the PSMDB-specific features were enabled in order to keep the configuration as similar as possible.
I used PLGM’s built-in “flights” workload (collection airline.flights, 7 secondary indexes):
I ran the workload three times, with three data sizes:
Queries read the seeded documents, while inserts keep adding new ones, so the collection grows during the run. “Fits in RAM” here means the compressed data still fits in the operating system’s file cache, so a WiredTiger cache miss usually doesn’t need a disk read. With 8M documents, the compressed collection is about as big as the server’s entire memory. The compression ratio is about 2:1, so 25% of the documents can fit in WTcache. All runs were deterministic. Each command is generated from a fixed seed, iteration, worker and operation number, so every MongoDB version received exactly the same commands with the same values, and in the same order for each worker. Each worker had a pass of 250,000 commands per iteration. In the 1M and 4M runs every version finished at least one full pass, and PLGM’s traffic fingerprints matched. In the 8M run the servers were too slow to finish a pass in 30 minutes, so each version sent the first 2.7–2.8M commands of the same sequence. PLGM flags that as incomplete. Because the commands are still identical, I compared them operation by operation anyway. PLGM ran the three versions one after another, so each one had the load generator to itself.
Figure 1: Throughput with 1M, 4M and 8M documents. Percentages are relative to MongoDB 9.0.4.
Figure 2: Average latency with 1M, 4M and 8M documents.
Figure 3: Throughput over time with 1M documents, in 1-minute averages. Each line is plotted on its own run clock.
Figure 4: Throughput over time with 4M documents, in 1-minute averages. 9.0 stayed ahead for the whole run.
Figure 5: Throughput over time with 8M documents, in 1-minute averages. The three lines overlap most of the time.
本页为82搜索生成的网页快照,内容来自站内索引;演示数据的原文链接仅作示例。