网页
综合
更新时间 2026-11-13 19:17:39
Sources & method · Dream Again USA
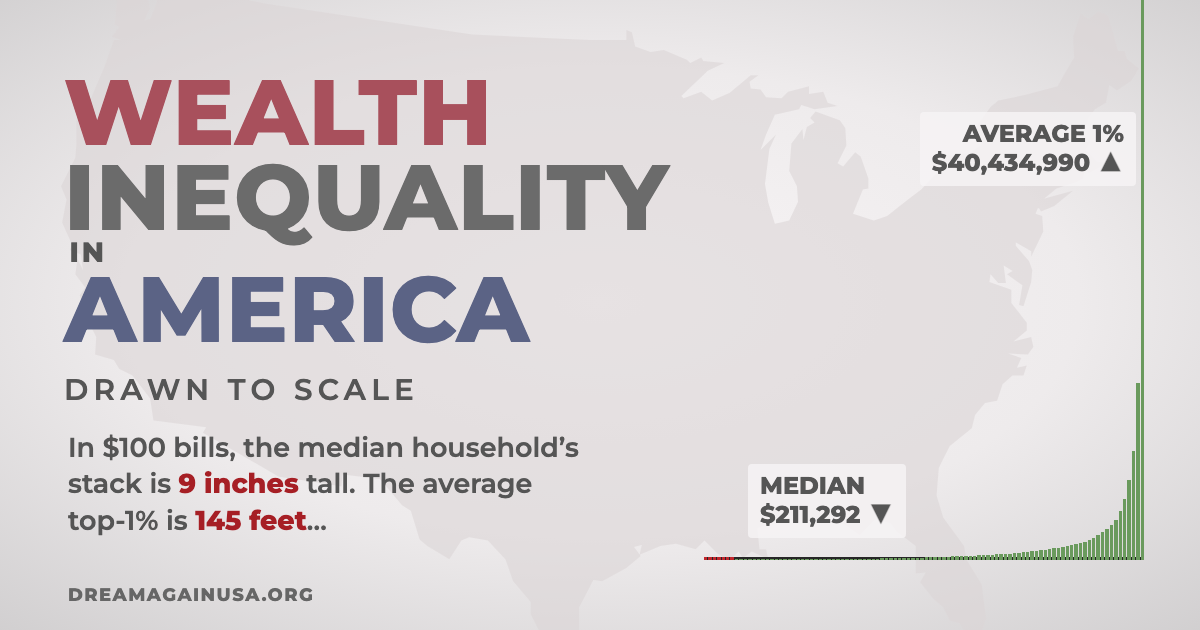
The Climb and the printable graph follow the data and calculations in Inequality in America: Companion by politizane (September 2026, v9.25.26), which documents every source, table, and adjustment behind the videos.
Read the Companion (PDF)
The graph lines up U.S. households from poorest to richest in 100 groups of about 1.36 million households each. The little figures under the bars stand for households, not individual people. A household can be one person living alone or a whole family.
The Companion’s chart (Table 9) shows the poorest 8% of households at $0 and notes they actually have less than nothing. This site plots their reported negative net worth instead, using the 2023 values in the Companion’s Appendix 2 with the same ×1.1 adjustment. The values run from −$84,119 for the poorest 1% to $1 at the 8th percentile.
In 2011, Michael Norton and Dan Ariely asked more than 5,000 Americans how they thought wealth was split between the five fifths of households, and how they would ideally split it. The Companion spreads those five shares across all 100 percentiles of the 2026 wealth total in a smooth curve (Appendix 3). Many different curves fit five numbers, so these two shapes are only illustrations. The actual bars come from percentile-level data. These two curves do not.
The “Actual” row is each fifth’s share of the total in the Companion’s Table 10 (calculated with the poorest 8% at $0): 0.06%, 0.99%, 3.61%, 9.69%, and 85.65%. “Think” and “Ideal” are Norton and Ariely’s survey shares. Labels on the bars are rounded, so they may not add to exactly 100%.
The Companion lists every source in full, chapter by chapter.
Read the Companion (PDF)
The graph lines up U.S. households from poorest to richest in 100 groups of about 1.36 million households each. The little figures under the bars stand for households, not individual people. A household can be one person living alone or a whole family.
The Companion’s chart (Table 9) shows the poorest 8% of households at $0 and notes they actually have less than nothing. This site plots their reported negative net worth instead, using the 2023 values in the Companion’s Appendix 2 with the same ×1.1 adjustment. The values run from −$84,119 for the poorest 1% to $1 at the 8th percentile.
In 2011, Michael Norton and Dan Ariely asked more than 5,000 Americans how they thought wealth was split between the five fifths of households, and how they would ideally split it. The Companion spreads those five shares across all 100 percentiles of the 2026 wealth total in a smooth curve (Appendix 3). Many different curves fit five numbers, so these two shapes are only illustrations. The actual bars come from percentile-level data. These two curves do not.
The “Actual” row is each fifth’s share of the total in the Companion’s Table 10 (calculated with the poorest 8% at $0): 0.06%, 0.99%, 3.61%, 9.69%, and 85.65%. “Think” and “Ideal” are Norton and Ariely’s survey shares. Labels on the bars are rounded, so they may not add to exactly 100%.
The Companion lists every source in full, chapter by chapter.
本页为82搜索生成的网页快照,内容来自站内索引;演示数据的原文链接仅作示例。